Venn diagrams have been around since 1880, when people started using them as a way to visually represent relationships between groups.
They have been helping us organize information, solve problems, and think logically. Few math tools are this versatile or this consistently useful across so many topics and grade levels.
Today, our seasoned tutors walk you through what a Venn diagram is, its most important parts, how to read and make one, how the Venn diagram formula works, and where you will encounter it in math.

What Is a Venn Diagram?
A Venn diagram is a visual tool that uses overlapping circles to show the relationships between two or more groups. It shows what they have in common and what makes each one unique.
It was introduced in 1880 by English mathematician John Venn in a paper on symbolic logic.
Venn diagrams are used in math, science, logic, and everyday thinking to organize information clearly and spot connections between groups.
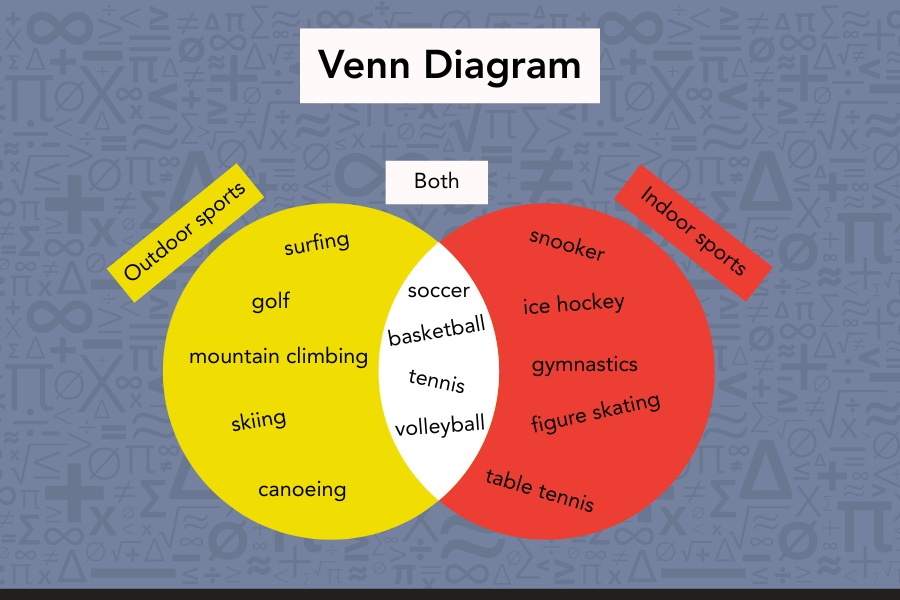
For example, some sports are played indoors, some outdoors, and some can be played in either setting. A Venn diagram makes those relationships immediately visible, like so:
Parts of a Venn Diagram
Before we can read or build a Venn diagram, it helps to know what each part is actually called and what it does.
-
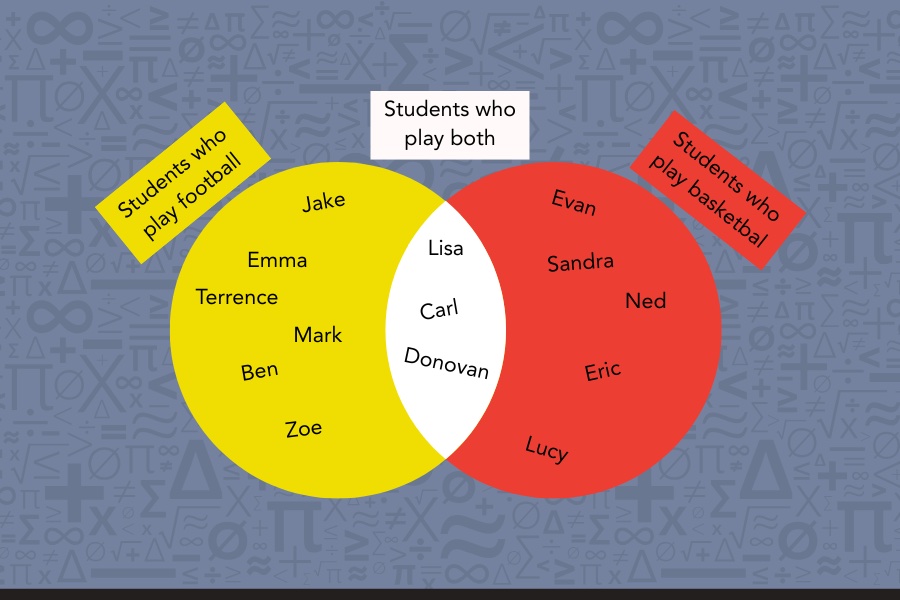
The circles. Each circle represents one group. Everything inside a circle belongs to that group and that group only. If one circle represents football players and the other represents basketball players, what would go inside the football circle only? That's right, students who play football but not basketball.
-
The overlapping section. The area where the two circles meet is called the intersection. It contains everything that belongs to both groups at the same time. In our example, this is where students who play both football and basketball go. Can you think of something else that might belong in the middle?
-
The area outside both circles. Anything that belongs to neither group sits here. This region is easy to overlook, but it is just as meaningful as the circles themselves. Here sit students who don’t play either sport.
📕 You May Also Like: 5 Practical Ways to Use Diagrams and Drawings for Math Problems
How to Read a Venn Diagram
Identifying the parts of a Venn diagram and actually reading one are two different skills. A diagram is only useful if we can look at it and pull out the right information.
Let's put that into practice with a real example.
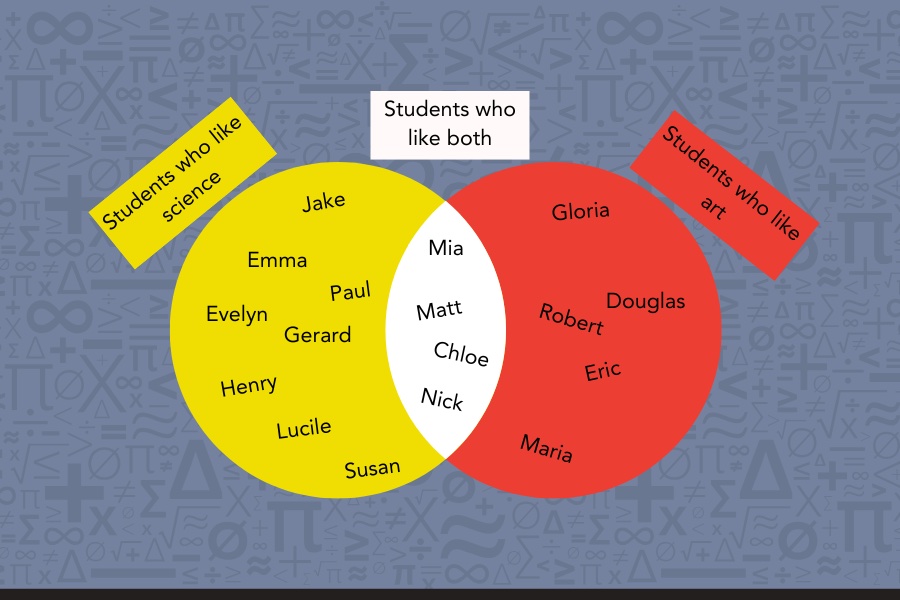
A Venn diagram shows two groups: 12 students who like science, 9 who like art, and 4 who like both.
Here is how to read it:
-
One circle only. So if 4 students like both, how many like only science? Take a moment. The answer is 12 − 4 = 8. That’s 8 students. The same logic applies to art: 9 − 4 = 5 students like art only.
-
The intersection. The 4 students who like both sit in the overlap. They belong to both circles at the same time.
-
Outside both circles. Any student who likes neither subject sits outside both circles entirely. This region has its own meaning, so don’t ignore it.
-
Totals without double-counting. Add the three separate regions: 8 + 5 + 4 = 17 students total. Adding 12 + 9 directly gives 21 because it counts the 4 students in the overlap twice.
Now that you can read a Venn diagram, let's try building one from scratch.
📕 You May Also Like: How to Teach Math to Visual Learners
How to Make a Venn Diagram
Ready to build one yourself? Follow these six steps, and you will have a completed Venn diagram in minutes. We will use cats and dogs as our example.
1. Identify your two groups and label them. In our case: cats and dogs.
2. Draw two overlapping circles. The more the two groups have in common, the bigger the overlap.

3. Fill in the left circle. List everything that belongs to the first group only. Cat only: miaows, climbs trees, retracts claws, largely independent.

4. Fill in the right circle. List everything that belongs to the second group only. Dog only: fetches, barks, needs walks.
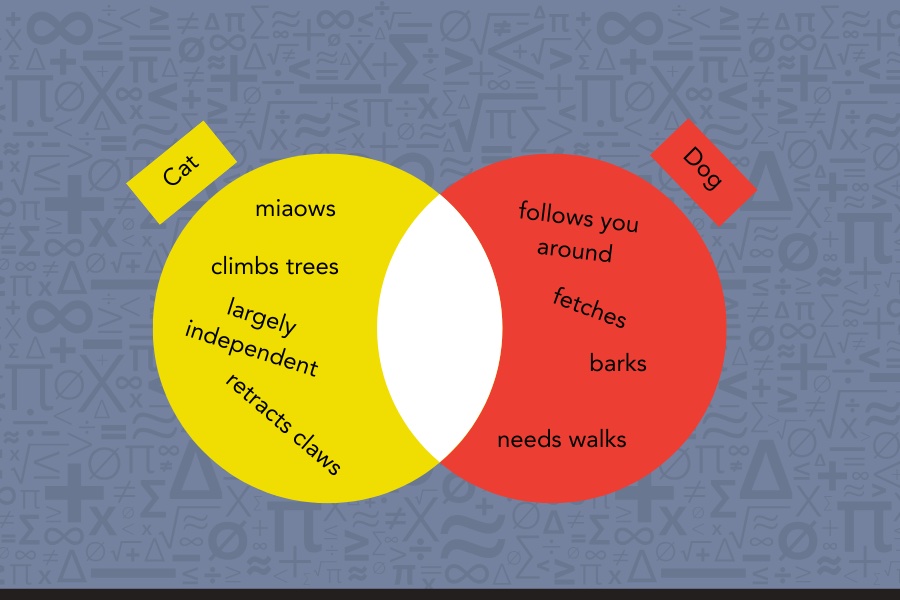
5. Fill in the overlap. Place everything that applies to both groups in the middle. Both: four legs, fur, kept as pets, need feeding.

That’s it. Not so hard, right?
📕 You May Also Like: What Is a Bar Model in Math? A Complete Overview
The Venn Diagram Formula
The formula comes into play when Venn diagrams stop being a sorting tool and start being a calculation one.
Students typically encounter it in middle school, and the most common situation is this: we know how many elements are in each group and how many are in both, and we need to find the total without counting anyone twice.
Say 28 students take algebra and 19 take geometry, and 8 take both. Adding 28 and 19 gives 47, but that is not the right answer. Those 8 students who take both courses just got counted twice. The real total is 39.
The formula makes sure that never happens:
n(A ∪ B) = n(A) + n(B) − n(A ∩ B)
In plain language:
-
n(A ∪ B): the total number of elements in either group or both, called the union
-
n(A): the number of elements in the first group
-
n(B): the number of elements in the second group
-
n(A ∩ B): the number of elements in both groups, called the intersection, subtracted to remove the double-count
So if we use that for our example, n(A ∪ B) = 28 + 19 − 8 = 39 students in total.
Does that make sense? Wonderful!
📕 You May Also Like: How to Use Model Drawing for Word Problems
Where Venn Diagrams Show Up in Math
Venn diagrams appear across different areas of math as you move through school.
-
Sorting and classification: In early grades, Venn diagrams help sort objects by shared and unique properties. Which shapes are red? Which has four sides? Which are both?
-
Set operations: In middle school, Venn diagrams become the primary visual for unions, intersections, and complements, which make a lot more sense when you can see them laid out in overlapping circles.
-
Probability and data analysis: In upper grades, Venn diagrams organize outcomes and calculate probabilities, particularly in problems where two events overlap.
Time to Check Your Venn Diagram Knowledge
By now, you have gotten the hang of Venn diagrams. Why not put that to the test? Work through the two challenges below and check your answers at the end.
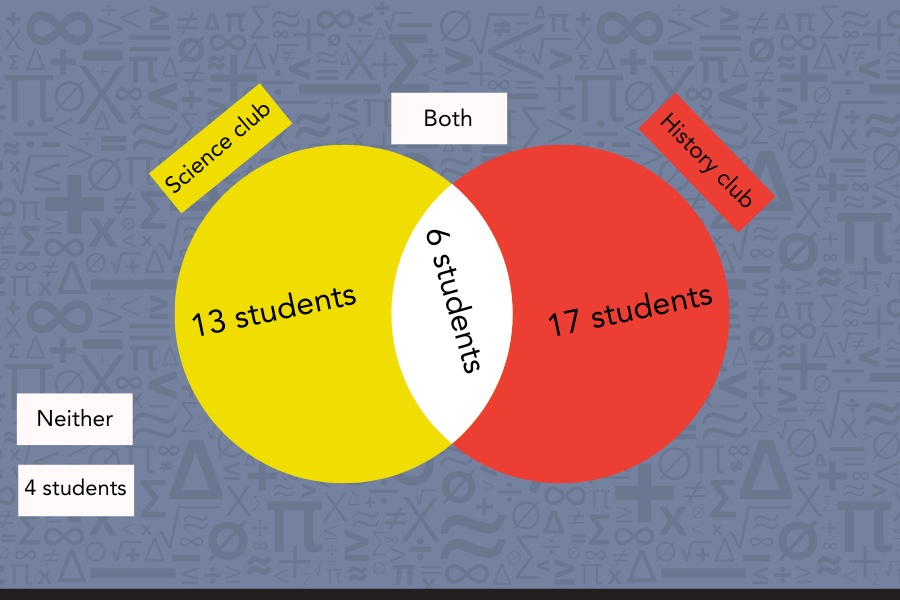
Challenge 1: Read the Diagram
Look at the Venn diagram below and answer these questions:
-
How many students are in the science club only?
-
How many students are in the history club only?
-
How many students are in at least one club?
-
How many students are in the science club in total, including those in both?
-
How many students are there altogether, including those in neither club?
Challenge 2: Build Your Own
In a class of 30 students, 18 play a musical instrument, 12 play a sport, and 7 do both. Draw a Venn diagram to represent this information, then answer: how many students play an instrument or a sport?

Mathnasium tutors build Venn diagram skills from the ground up, starting with the regions, working through the logic, and connecting it all to the probability and set theory topics where it really counts.
How Mathnasium Helps Students Master Any Math Concept
Mathnasium is a math-only learning center dedicated to helping K–12 students learn and master math at every level.
When students need support with topics like Venn diagrams or the broader set theory, logic, and data analysis concepts they connect to, Mathnasium teaches for deep understanding, not memorization.
The Mathnasium Method™ makes that possible. This is not a one-size-fits-all curriculum but a proprietary teaching approach, designed around how each student learns best.
Here’s how the approach works.
Each student begins with a diagnostic assessment, which helps us pinpoint each student’s current skills and knowledge gaps. With these insights, we create a personalized learning plan tailored to their needs and goals.
With the plan in place, our specially trained tutors deliver face-to-face math instruction in a supportive and fun setting.
To make concepts like Venn diagrams land, we use simple language and rely on a mix of verbal, visual, tactile, and written techniques. When students are stuck on a math problem, we break it down into manageable bits, showing both the how and the why behind the answer.
Working with our tutors, students develop valuable critical thinking tools and problem-solving skills they can use in math and life.
Fun is a core part of our method. Our activities are often game-based and hands-on, keeping students engaged and making learning enjoyable. We track their progress and celebrate each win, big or small, building their confidence with every session.
The results are real and measurable:
-
94% of parents report an improvement in their child's math skills and understanding
-
93% of parents report an improved attitude toward math after attending Mathnasium
-
90% of students saw an improvement in their school grades
With more than 1,100 learning centers across North America, there is likely a Mathnasium near you.
In Goodyear, AZ, Mathnasium of Litchfield Park & Goodyear is a trusted local resource with years of experience building confident math thinkers. Our center has earned over 100 glowing Google reviews and has been recognized as a multi-year winner of Best of the Desert in the Tutoring / Learning Center category.
Whether your child needs to catch up, keep up, or get ahead in math, we are happy to help.
Ready to take the first step?
📅 Schedule a Free Diagnostic Assessment at Mathnasium of Litchfield Park and Goodyear
Not near our center?
📍 Find a Mathnasium Learning Center Near You
Pssst! Check Your Answers Here
If you've given our challenges a try, check how you did below.
Challenge 1
-
Science club only: 13 students
-
History club only: 17 students
-
Students in at least one club: 13 + 17 + 6 = 36 students
-
Science club in total (including both): 13 + 6 = 19 students
-
Students altogether (including neither): 36 + 4 = 40 students
Challenge 2
Your diagram should look like this:
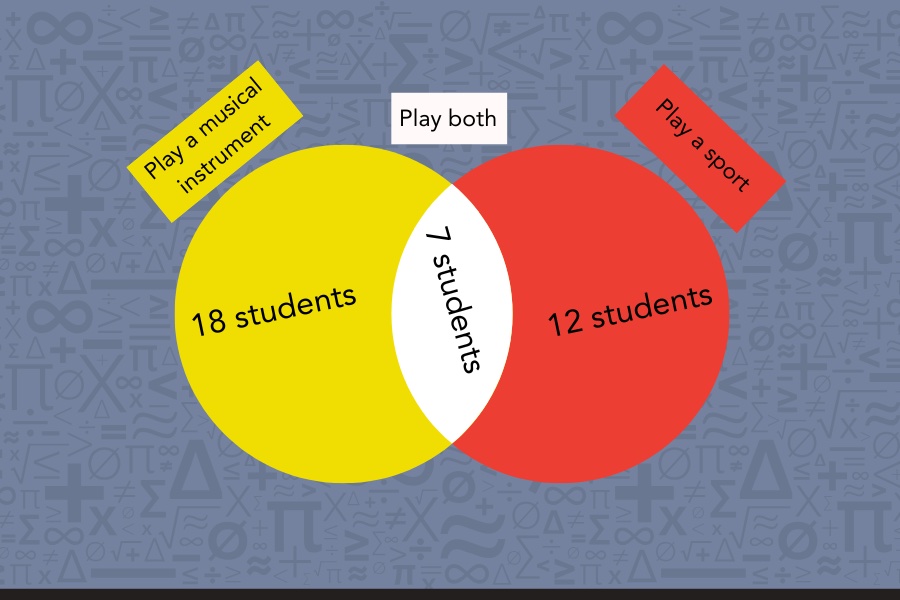
Using the formula n(A ∪ B) = 18 + 12 − 7 = 23 students play an instrument or a sport.
The remaining 7 students (30 − 23) play neither.


 (623) 213-8653
 (623) 213-8653