


What is a Graph?
A diagram that shows the relationship between two or more quantities.
In math, a graph is a visual representation that shows how two or more quantities are related. It helps us see patterns, trends, and comparisons quickly and clearly.
Graphs can use points, lines, bars, or pictures to display information, depending on what type of data we’re looking at.
Because there are many ways to represent relationships between quantities, there are many types of graphs. Some of the types of graphs you may encounter in school are:
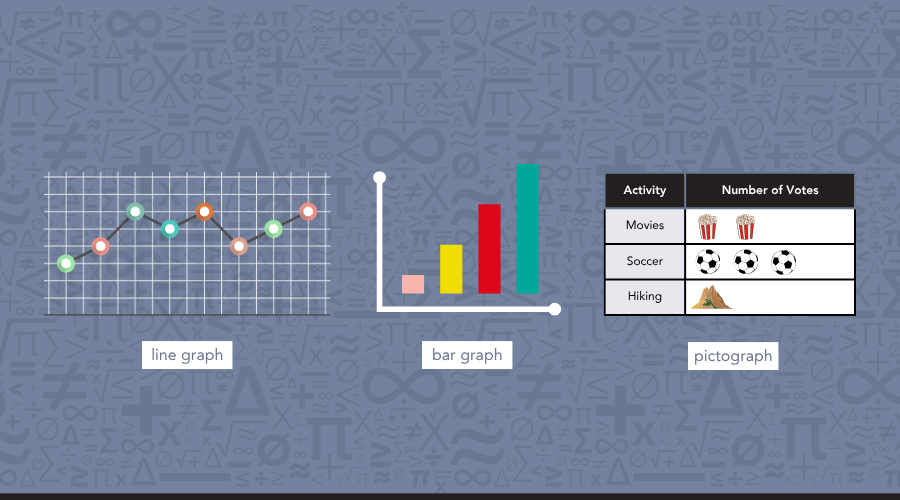
- A line graph might show how temperature changes over time.
- A bar graph might compare the number of pets in different households.
- A picture graph (or pictograph) might use images to represent quantities, like apples or books.
Graphs help us interpret and analyze data, find trends, and make predictions.
When Do Students Learn About Graphs?
Students begin learning about simple graphs in early elementary grades, and their understanding grows as they explore more complex data and relationships.
Grades 1–2 – Introduction to Graphs
Students read and create simple bar graphs and pictographs using data from everyday situations.
Grades 3–5 – Using Graphs to Represent Data
Students begin using line graphs, coordinate grids, and more advanced bar graphs. They learn to interpret and compare data sets.
Grades 6+ – Working with Graphs in Algebra and Data Analysis
Students learn to plot equations, analyze data, and use graphs to solve problems involving linear and nonlinear relationships.