


What is a Bar Graph?
A diagram that shows the relationship between two quantities
A bar graph, or bar chart, is a way to show the relationship between two quantities using bars, where each bar represents a quantity, and the length or height of the bar shows how much it represents.
A simple bar graph would look like this:
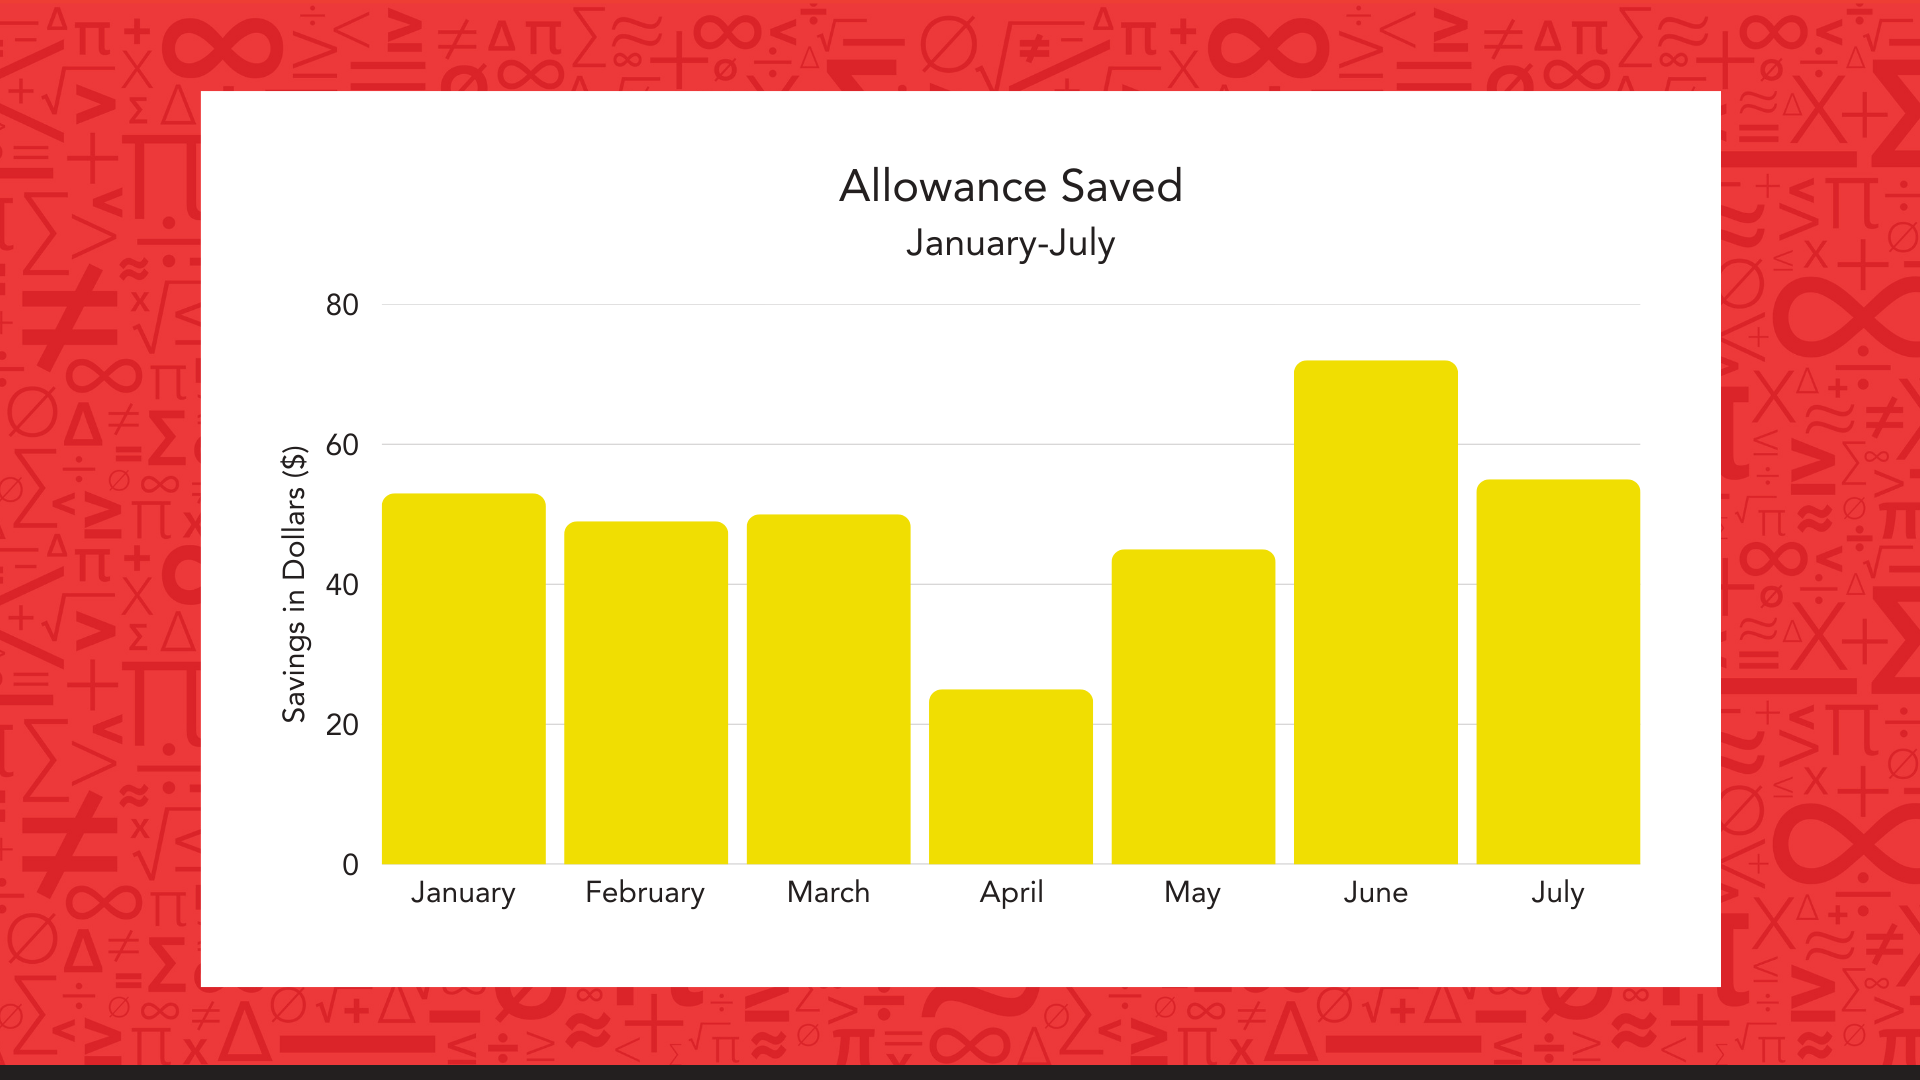
There are many ways to draw bar graphs, but to make them easy to read and understand, they should always include:
- A title to explain what the graph shows
- Bars that represent quantities or amounts
- Labels for the categories being compared
- A scale that shows the value each bar length represents
When Do Students Learn About Bar Graphs?
Students begin learning about bar graphs early as part of data collection and graphing skills.
Grades 1–2 – Introduction to Bar Graphs
Students learn to read and make simple bar graphs using pictures or objects to represent data.
Grades 3–5 – Using Scaled Bar Graphs
Students create bar graphs with scales, use them to solve word problems, and compare data sets visually.
Grades 6+ – Interpreting Complex Graphs
Students use bar graphs in statistics, analyze multi-variable data, and interpret graphs with larger scales.