


What is a Line Plot?
A graph that shows data along a number line using Xs, dots, or other marks to show frequency
A line plot is a simple way to organize and display data. It uses a number line to show how often each value appears in a set. Each mark (like an X or a dot) above the number line stands for one item or one occurrence.
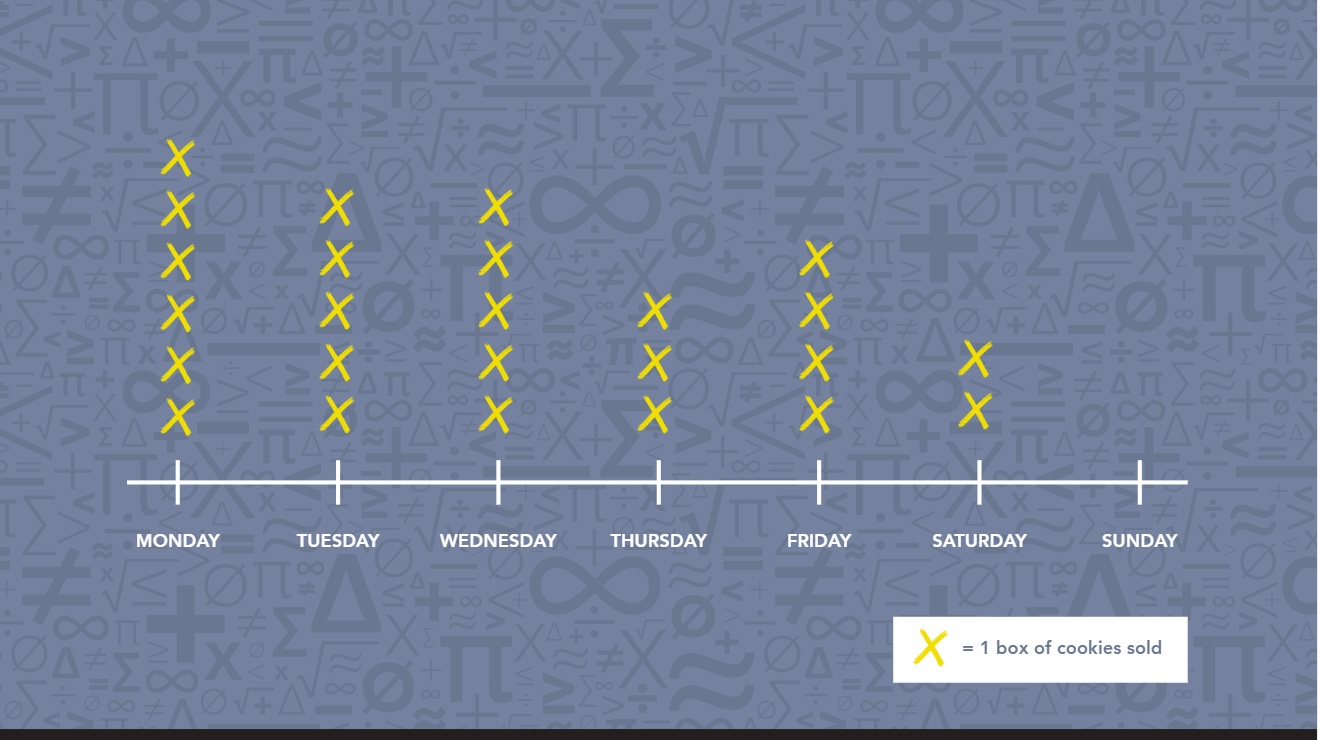
Line plots help us quickly see patterns in data, like the most or least common values. In our example above, it’s easy to see that the most common values (or mode) are 5 boxes of cookies sold on Tuesday and Wednesday.
Line plots are often used in class surveys, measurement activities, and real-life data collection projects.
When Do Students Learn About Line Plots?
Students usually start creating simple line plots in the second grade of elementary school and move on to more complex data visualization using line plots with fractions in fourth and fifth grades.
Grades 2–3 – Introduction to Line Plots
Students learn to create and read line plots using whole numbers. They begin connecting data to real-world situations.
Grades 4–5 – Line Plots with Fractions
Students work with line plots that include fractions and solve problems using data displayed on the plots.